
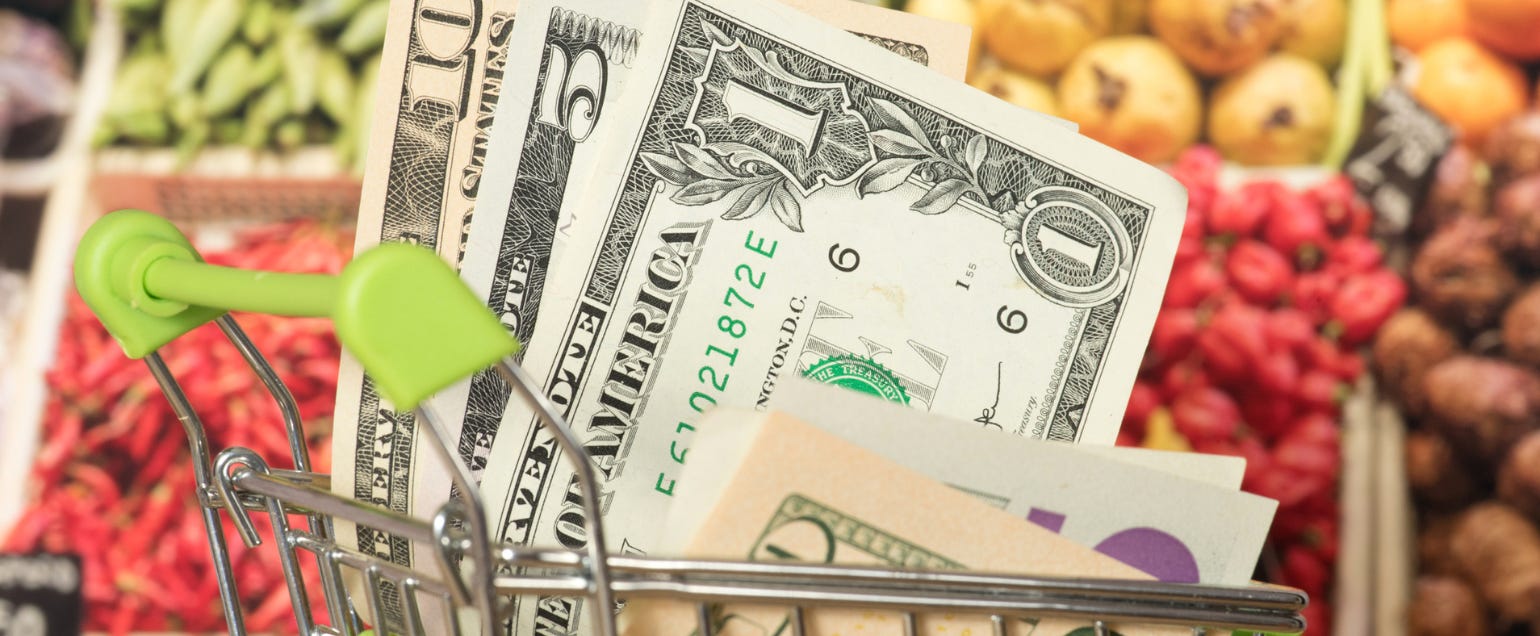
Are Grocery Stores Price Gouging?
Today's Key Concept: Gross Margin

The News
Kamala Harris recently sparked discussion by accusing grocery stores of price gouging. Today, we’ll dive into the financial statements of a publicly traded grocery chain in order to investigate the claim: are grocery stores price gouging?
The Concept
First, we'll review key financial terms, focusing on the relevant income statement line items. Next, we'll select the best public grocery chain for our analysis. Finally, we'll examine changes in financial metrics over time to determine if there's any evidence of price gouging.
Step 1: Financial Terms Review
Revenue: This is the total amount of money a business earns from selling its products or services before any expenses are deducted. It’s often referred to as the "top line" because it sits at the top of the income statement. For grocery stores this would be the total amount they get paid from customers who buy their products.
Cost of Goods Sold (COGS): COGS represents the direct costs of producing the goods or services that a company sells. This includes costs like raw materials and labor but excludes indirect expenses like marketing, management salaries, office leases and other “overhead” items. For grocery stores this is how much it costs them to purchase the items that they sell in their stores from wholesalers and distributors.
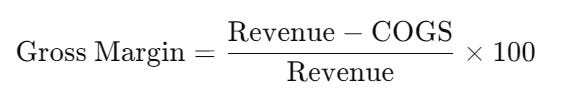
Gross Margin: Gross margin is the difference between revenue and COGS, expressed as a percentage. It shows how much of each dollar of revenue is left after covering the direct costs of producing or purchasing the products it sells. For grocery stores, this will be the key for our investigation. Gross margin is calculated as:
To simplify further, you can visualize this concept using a single gallon of milk. If it costs the grocery store $8 to buy it from the farmer and they sell it for $10, then they make only $2 for a 20% margin.
Step 2: Which Company Should We Use?
I quickly looked up the top grocery stores in the U.S. and found that they are: (1) Walmart, (2) Amazon, (3) Costco, (4) Kroger, and (5) Walgreens.
Walmart and Amazon also sell a wide range of non-grocery items, so analyzing their grocery segments alone wouldn’t give us a clear picture. Costco’s membership model makes it difficult to assess margins accurately. Kroger, however, is the best candidate for our analysis because it’s a large, focused grocery chain with thousands of locations, making it ideal for a more straightforward evaluation.
Step 3: How Has Gross Margin Changed?
Now we can investigate. The table below shows Kroger’s revenue, COGS, gross profit, and gross margin going back to the beginning of 2022 so that we can compare today’s margin to the “normal” margin in previous years.
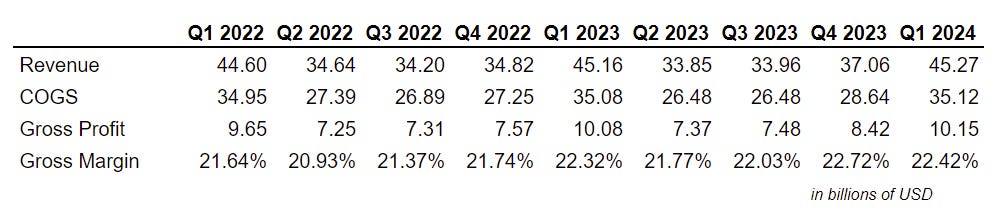
The gross margin has shown a slight increase, rising from 21.64% in Q1 2022 to 22.42% in Q1 2024. When we compare this to the long-term average gross margin of 21.82% since 2012, the gross margin is only 2.7% higher, which suggests that Kroger isn’t significantly boosting profits through price increases.
While this analysis doesn't examine individual products (Kroger has admitted to raising prices more on some items), it’s difficult to argue that they’re profiting from price gouging. Other factors, such as inflation, might be at play. Curious about inflation’s role? Check out our YouTube video where we break down the concept in detail!
The Quiz
You can reply to this email or write in the comments with your answers!
What is the formula for calculating gross margin?
What are some examples of costs that are NOT typically included in COGS?
Revenue - COGs / Revenue X 100
Marketing, salaries and over-head costs
Interesting breakdown. Unfortunately, you probably don't need math to back up Kamala's point - it's just too enticing to take on faith, hah.
There's an interesting podcast analysis on Acquired.fm about Costco and how they think about margins. It was good enough that even if they had a grocery only statement I wouldn't bother looking too closely. They're fanatical about a MAX gross margin they'll allow.